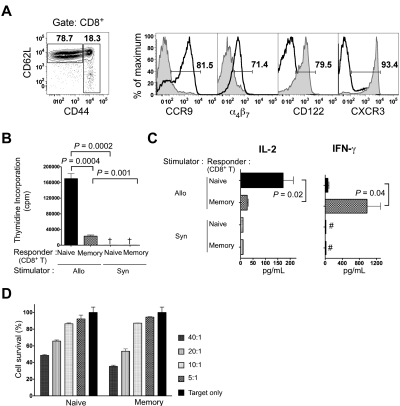
Figure 2.
Characterization of naive and memory phenotype CD8+ T cells. (A) C57BL/6 splenocytes were stained with anti-CD8, anti-CD44, and anti-CD62L mAbs. Gated CD62LhiCD44low and CD44hi CD8+ T cells were analyzed for CCR9, α4β7, CD122, and CXCR3 expression. Gates were determined by isotype staining. Histogram plots of the respective markers are overlaid for CD44lo CD8+ T cells (bold line) and CD44hi CD8+ T cells (tinted area). (B) 3H-thymidine incorporation (mean ± SE) of C57BL/6 responder naive or memory phenotype CD8+ T cells (2 × 10⁵) to BALB/c stimulator cells (8 × 10⁵) at day 5 in the MLR in 3 replicate wells for each cell combination. Results are representative of at least 3 MLR experiments. Allo and Syn, BALB/c and C57BL/6 stimulator cells, respectively. †3H-thymidine incorporation < 5000 cpm. (C) Cytokine responses of C57BL/6 donor naive or memory phenotype CD8+ T cells (1 × 10⁵) to irradiated BALB/c stimulator cells (5 × 10⁵) in the MLR are shown at 60 hours. The left panel shows the mean ± SEM concentrations of IL-2 and the right panel shows the mean ± SEM concentrations of IFN-γ. #Cytokine concentration < 10 pg/mL. Results are representative of at least 3 MLR cultures. (D) Sorted naive and memory cells were used in a cytotoxicity assay against luc+ BCL1 cells. Sorted naive or memory phenotype CD8+ T cells were stimulated with irradiated BALB/c splenocytes for 96 hours. BCL1 lymphoma cells expressing luciferase were mixed with stimulated naive or memory phenotype cells at various effector-to-target ratios. Luciferase signal was measured after 16 hours. Percent cytotoxicity was then determined compared with the same target numbers without effector cells at each time point.

