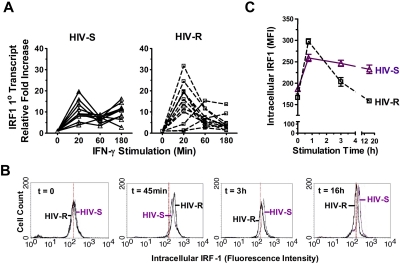
Figure 3.
Kinetics of IRF1 responses to exogenous IFN-γ stimulation. (A) Ex vivo PBMCs from HIV-S (▵, n = 10) and HIV-R (□, n = 12) individuals were stimulated with exogenous IFN-γ (10 ng/mL). At the indicated time points, RNA were isolated and IRF1 primary RNA transcripts levels were examined using quantitative RT-PCR. There was no significant difference in transcript levels between the unstimulated samples (time = 0, 20, 60, or 180 minutes). Unstimulated sample from time = 0 is used as reference for calculating relative fold increases. The RNA transcripts were normalized to endogenous 18S RNA. (B-C) Intracellular expression of IRF1 in ex vivo PBMCs from 6 HIV-S and 6 HIV-R individuals was examined at 45 minutes, 3 hours, and 16 hours after IFN-γ (10 ng/mL) stimulation. Intracellular staining was performed using IRF1 specific antibody and fluorescein isothiocyanate-labeled goat antirabbit antibody. Background signal from the secondary antibody alone was within the first log (100-101). The histogram plots of different time points were representative of the individuals examined in each group. Compilation of data from 6 independent samples from each group was graphed in panel C. The y-axis graphed the mean fluorescence intensity (MFI) of IRF1 staining.

