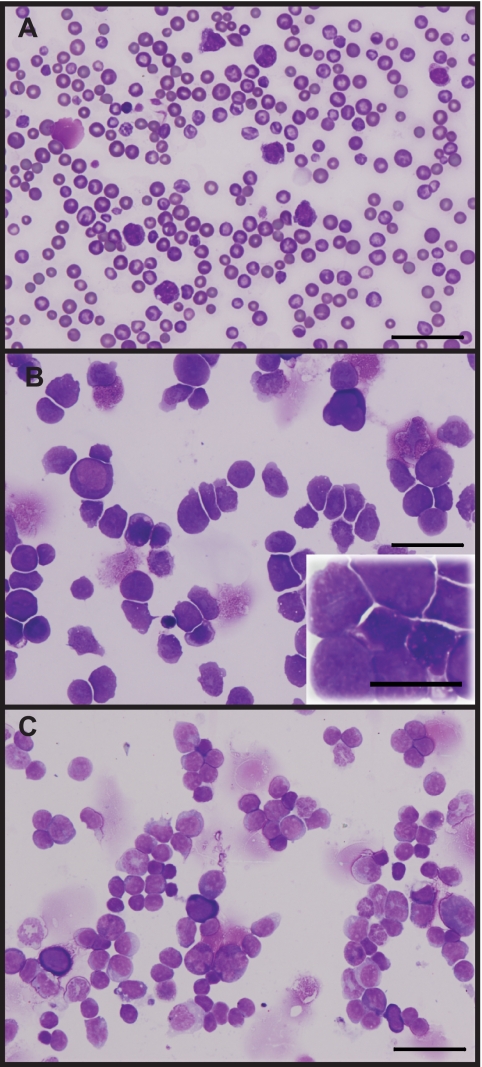
Figure 3.
A rare subset of hypoallelic mice transform to AML. Peripheral blood smear (A), BM cytospin (B), and spleen cytospin (C) showing more than 20% immature/blast cells. Scale bars represent 50 μm (60×/1.25 NA oil objective magnification, inset 100×/1.30 NA oil objective magnification). Images shown are from a representative AML stage NR4A1+/−NR4A3−/− mouse; analysis was conducted when animal was moribund (at 9 months).

