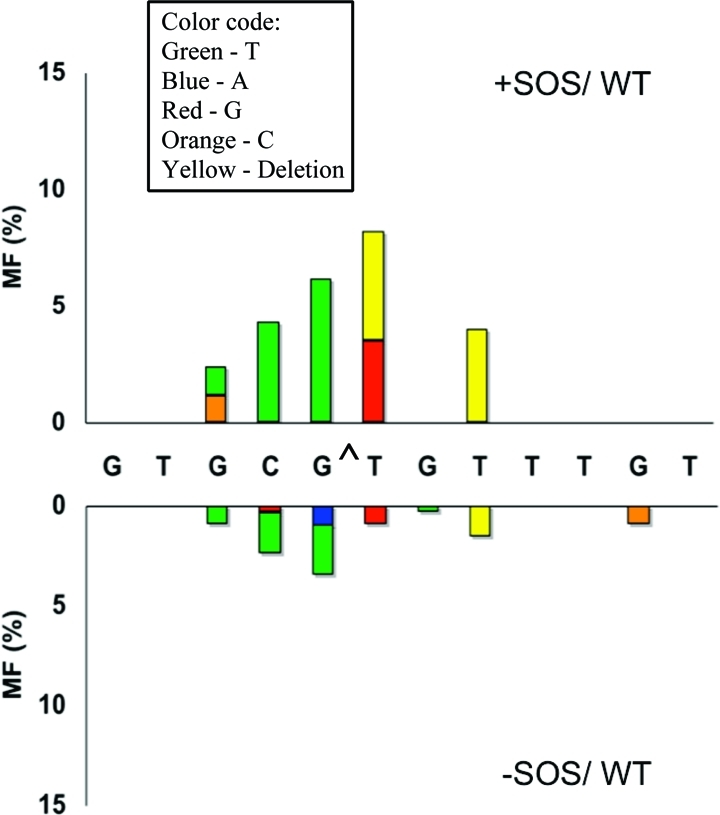
Figure 2.

Types and frequencies of single-base substitution or deletion induced by G[8,5-Me]T with (top) and without (bottom) SOS in wild-type (AB1157) cells. The following colors are used: green for T, blue for A, red for G, orange for C, and yellow for a one-base deletion. Deletion of T from the run of three T residues is arbitrarily shown at the T closest to the lesion.
