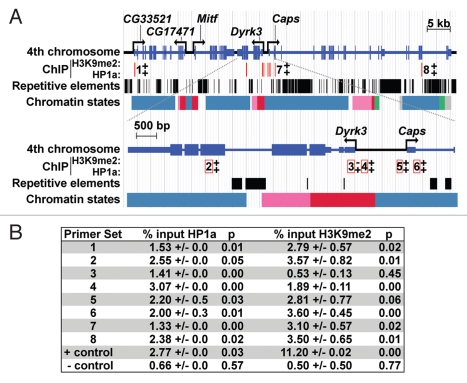
Figure 2.
The distribution of HP1a, histone H3K9me2, repetitive elements and chromatin states within the Dyrk3/Caps (A) genomic region. A diagram of the sub-telomeric region of the fourth chromosome is shown at the top; a magnification of Dyrk3 and the 5′ region of Caps is depicted below. Repetitive elements are represented by black boxes (taken from Repeat Masker track of the UCSD Genome Browser). Polyclonal antibodies to HP1a (Covance), H3K9me2 (Upstate) and GFP (Molecular probes) were used for ChIP from third instar salivary glands. The location of primer sets are indicated by red lines; numbers adjacent to (top) or within the open red boxes (bottom) correspond to the number of a primer set. +, a positive ChIP signal; −, a negative result. Primers for CG31999 at position 102B1 on chromosome 4 were used as a negative control. Primers corresponding to an hsp26 transgene integrated near the centric region of chromosome 4 were used as a positive control. This transgene is silenced in an HP1a-dependent manner.18 The chromatin states are described according to modENCODE:23 red represents enrichment of H3K4me3/2 and H3K9Ac (state 1) found at TSSs, pink represents enrichment for H3K36me3 (state 2) associated with transcription elongation; green represents enrichment for H4K16ac(state 5); blue represents enrichment for H3K9me2/3, which is found in heterochromatin (state 7); grey represents regions of very low transcriptional activity (state 9). (B) Data obtained from ChIP experiments; primer set numbers correspond to numbers in (A) and p denotes p values.

