
Figure 3.
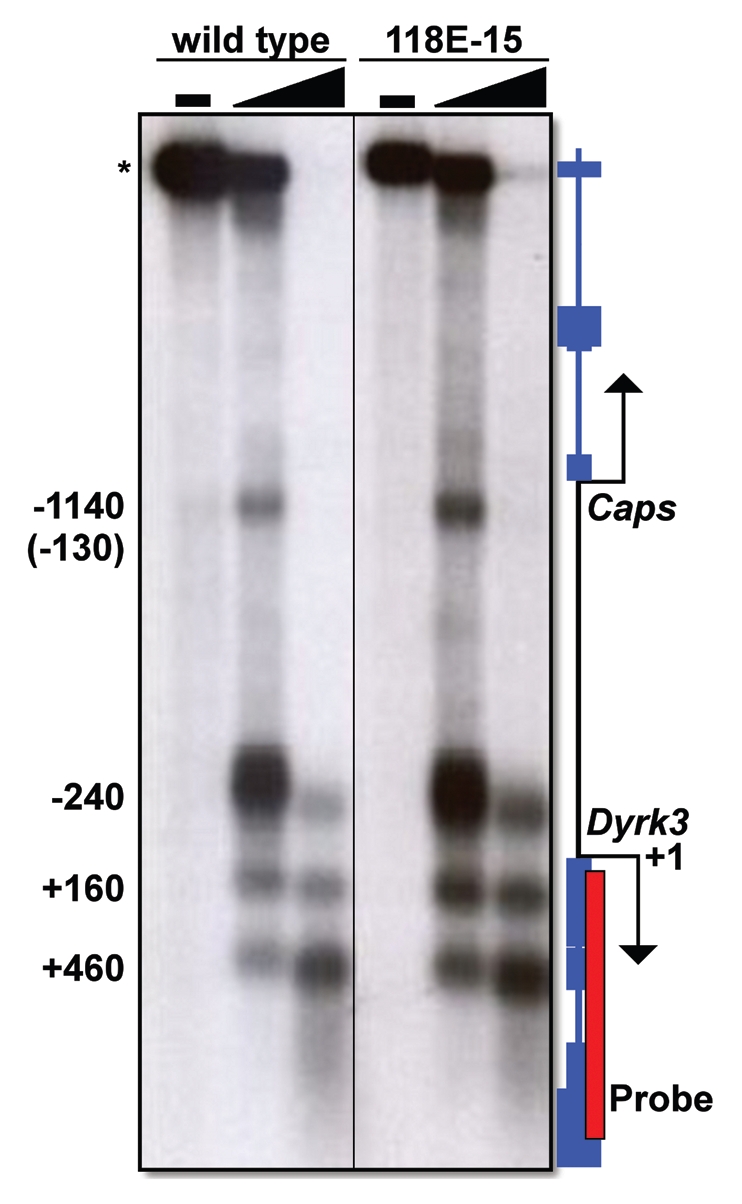
DNase I hypersensitivity analysis of the Dyrk3 and Caps promoter regions. Nuclei were isolated from larvae and treated with increasing amounts of DNase I. Genomic DNA was purified and digested to completion with NciI, which cleaves at sites flanking the region of interest. The DNA was separated by electrophoresis and transferred to a nylon membrane (Amersham). DNase I hypersensitive sites were detected following hybridization with α-32P labeled 842 bp fragment of Dyrk3 (red box). Numbers to the left of the radiograph denote the approximate locations of DNase I hypersensitive sites relative to the Dyrk3 transcription start site (+1).The * denotes the Ncil Fragment that is not cleaved by DNase 1. The number in parentheses represents the distance relative to the TSS of Caps.