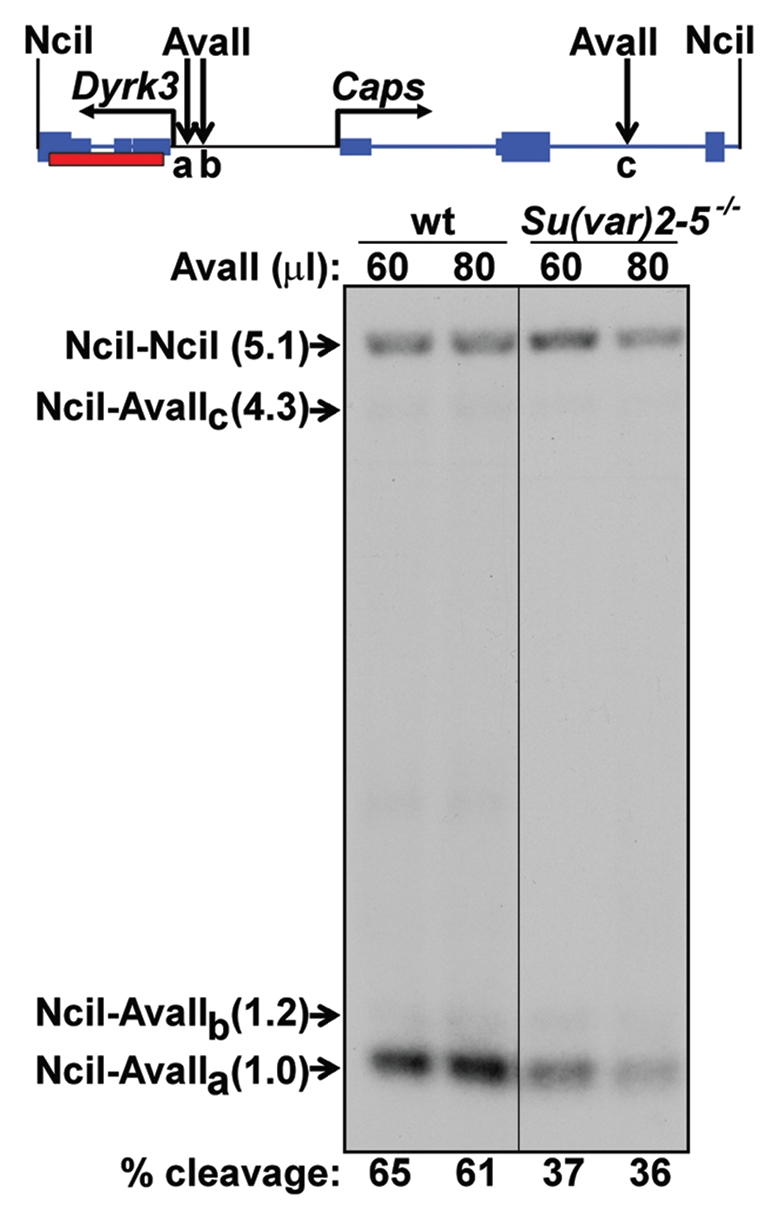
Figure 4.

Restriction enzyme accessibility analysis of the Dyrk3 and Caps promoter regions. Top: schematic of the Dyrk3-Caps region flanked by two NciI sites, labels are the same as in Figure 3, with the addition of AvaII sites (down arrows). Bottom: Southern analysis of fragments resulting from nuclei isolated from wild type (wt) or trans-heterozygous [Su(var)2-5-/-] larvae treated with AvaII. Purified genomic DNA was cut with NciI. The arrow indicates the position of the NciI-NciI parental fragment. The positions of the two fragments resulting from cleavage at the distal AvaII sites (B and C) are indicated. NciI-AvaIIa indicates the position of the quantifiable fragment resulting from cleavage at the proximal AvaIIa site. The red box indicates a fragment of Dyrk3 used as a probe. The percent cleavage at the proximal AvaII site is reported at the bottom. Cleavage at the AvaIIa site was quantified using Labworks software (UVP BioImaging Systems) and is reported as the percentage of the total signal from all four bands.
