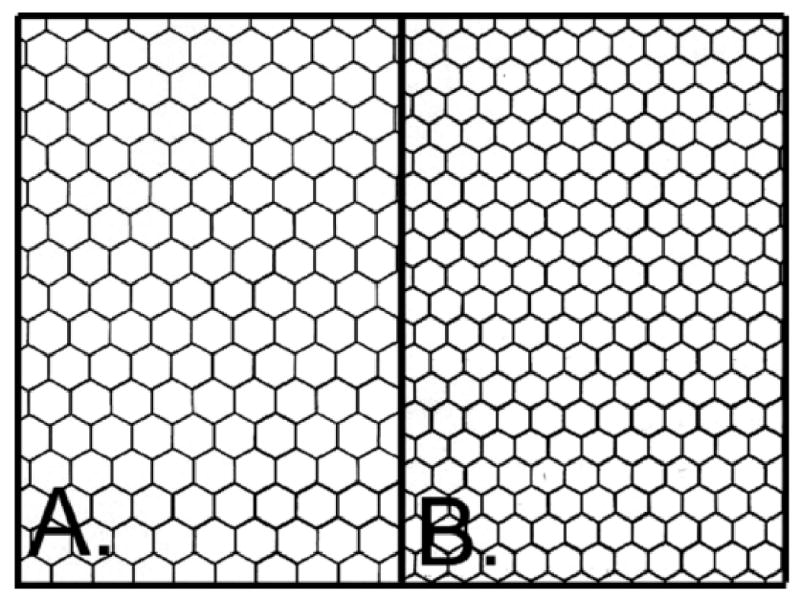
Figure 7.

Mean endothelial cell density values for ICCE patients (Inable eta 1985 32) are plotted in Graph A to demonstrate regional endothelial cell changes after superior incision ICCE. In Graph B, ECCE patient data from Schultz et al 33 shows regional endothelial cell changes after ECCE with IOL implantation with 1% sodium hyaluronate (Healon). Regrouped data from Hoffer 34 on regional endothelial cell changes after ECCE and phacoemulsification cataract extraction is plotted in Graph C.
