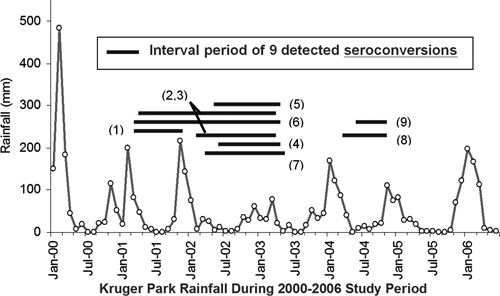
Figure 5.

Time series of seroconversion events, relative to rainfall, in Kruger National Park. Circles indicate monthly rainfall for the study area during 2000–2006. Horizontal gray bars indicate the intervals (period between observations) for the nine seroconversion events to antibody against Rift Valley fever virus among 126 initially seronegative buffalo that were repeatedly sampled during the study. To indicate their location, numbers in parentheses correspond to sites indicated in Figure 4 and reflect the order of detection of seroconverted animals during the period of the study.
