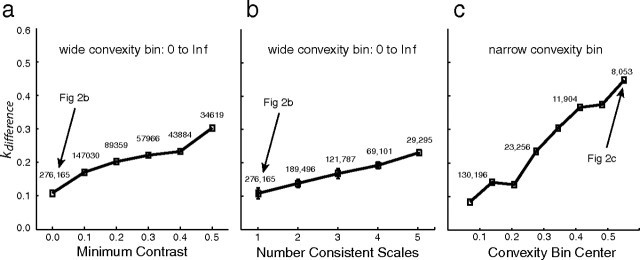
Figure 10.
The effect of contour properties on convexity–depth statistics. Each panel plots kdifference—the difference between the convex and concave power-law exponents (Fig. 3c)—for different subsets of the contours in the natural-scene dataset. a, kdifference as a function of contrast. Contours with different ranges of contrast were analyzed. The abscissa is the lowest contrast in the tested range (the highest contrast was always the same), so increasing abscissa values corresponds to higher average contrast. kdifference increases monotonically with increasing contrast. The arrow shows the conditions plotted in Figure 3b. b, kdifference as a function of the number of spatial scales for which the sign of region convexity is consistent. With increasing consistency, contours become more circular. kdifference increases monotonically as the consistency of convexity increases. c, kdifference as a function of the mean convexity of a narrow range included in the analysis. The width of the narrow bin is shown in Figure 3a. The arrow shows the conditions plotted in Figure 3c. As the mean convexity increases and more closely matches the convexity presented in psychophysical experiment, kdifference increases.

