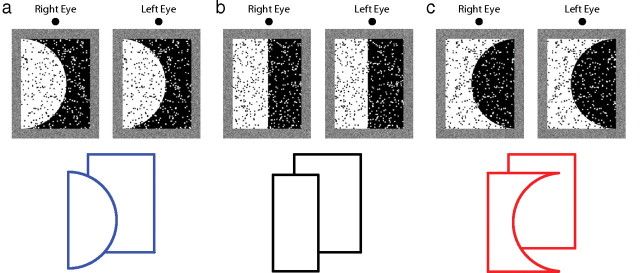
Figure 2.

Examples of the experimental stimuli. The upper row contains stereograms that can be cross-fused to reveal two regions at different distances. The lower row depicts the disparity-specified depth and contour shape for each stimulus type. a, “Consistent” stimulus: disparity and convexity both indicate that the white region is nearer than the black region. b, “Neutral” stimulus: disparity specifies that the white region is nearer, while convexity does not indicate which region is nearer. c, “Inconsistent” stimulus: disparity specifies that the white region is nearer and convexity suggests that it is farther. A reader who examines the stereograms closely might perceive a difference in depth separation between the different stimuli. But such an effect might not be apparent because, as our data show, the perceptual effect is small.
