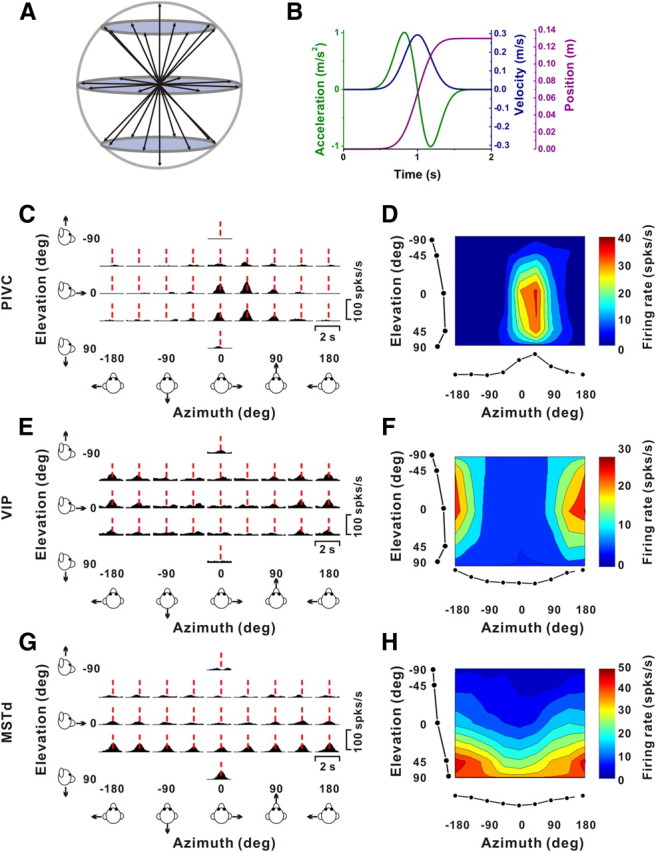
Figure 1.

Stimulus parameters and example responses from single-peaked cells. A, Schematic illustration of the 26 3D movement trajectories spaced 45° apart in both azimuth and elevation. B, All movements had a 2 s duration, originated from the center position, and had a Gaussian velocity profile (peak of 30 cm/s, blue) with a corresponding biphasic linear acceleration profile (peak of ±1 m/s2, green) and a sigmoidal displacement of 13 cm (magenta). C, E, G, Response PSTHs for three example neurons from PIVC (C), VIP (E), and MSTd (G). Vertical dashed red lines indicate the respective peak times, when the maximum response across directions occurred. PSTHs were computed with sequential 25 ms bins and then smoothed with a 400 ms sliding window (see Materials and Methods). D, F, H, Corresponding color contour maps showing 3D direction tuning profiles (Lambert cylindrical projection) at peak time (t) for the cells in C (t = 0.94 s, DDI = 0.77), E (t = 0.98 s, DDI = 0.70), and G (t = 1.08 s, DDI = 0.76). Tuning curves along the margins illustrate mean firing rates plotted versus elevation or azimuth (averaged across azimuth or elevation, respectively).
