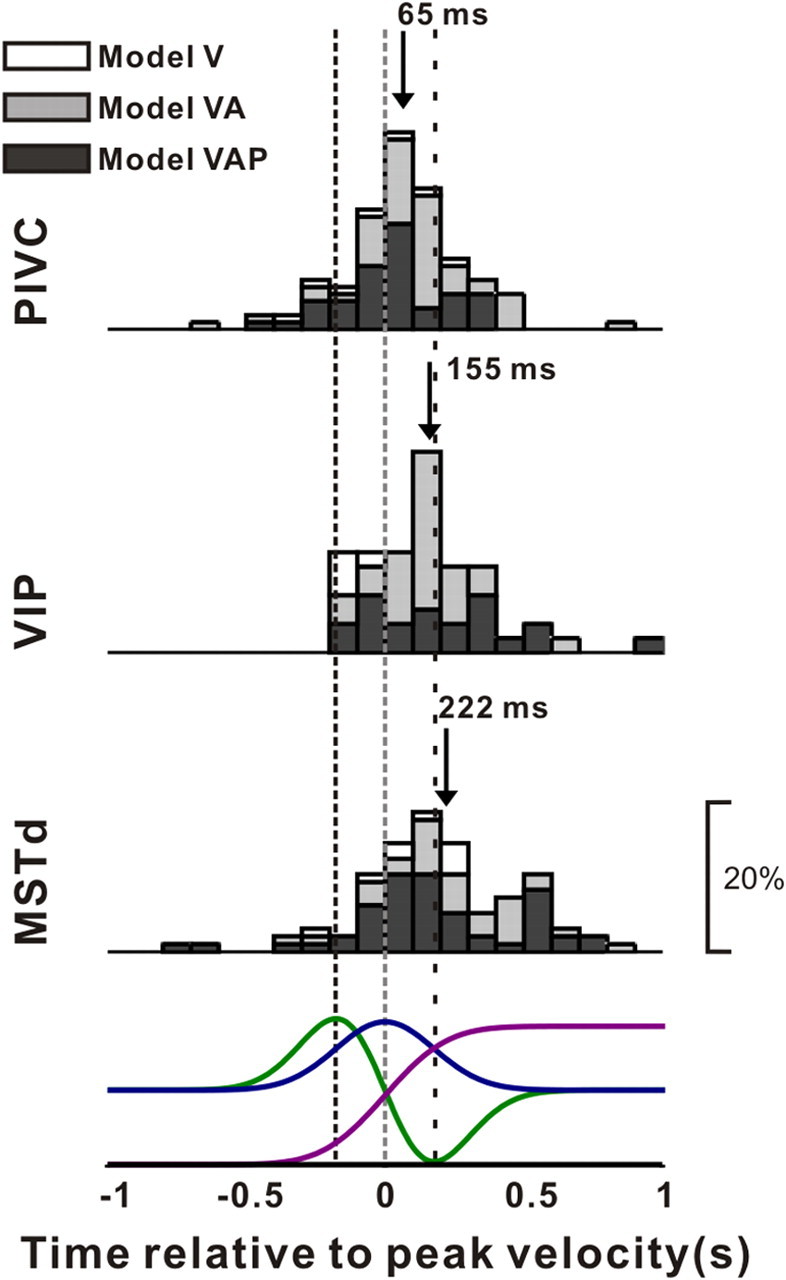
Figure 11.

Distributions of response latency, derived from model fits, for neurons in area PIVC (top), VIP (middle), and MSTd (bottom). Data shown are from the best-fitting model. Open bars, Cells better fit with model V; gray bars, cells better fit with model VA; black bars, cells better fit with model VAP. Arrows indicate mean values. Stimulus velocity (blue), acceleration (green), and position (magenta) profiles are shown in the bottom row. Vertical dashed lines indicate the times of peak acceleration/deceleration and peak velocity.
