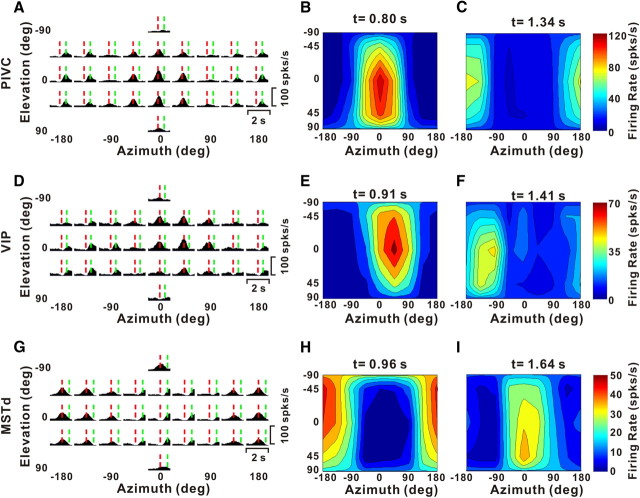
Figure 2.
Example responses from double-peaked neurons. A, D, G, PSTHs for three example neurons from PIVC (A), VIP (D), and MSTd (G). Vertical dashed red and green lines illustrate the two peak times for each cell. B, C, E, F, H, I, Color contour maps showing 3D direction tuning profiles (Lambert cylindrical projection) at the two peak times (t) for the cells in A (t = 0.80 s, DDI = 0.92 and t = 1.34 s, DDI = 0.86), D (t = 0.91 s, DDI = 0.74 and t = 1.41 s, DDI = 0.70), and G (t = 0.96 s, DDI = 0.74 and t = 1.64 s, DDI = 0.75). The format is as in Figure 1.

