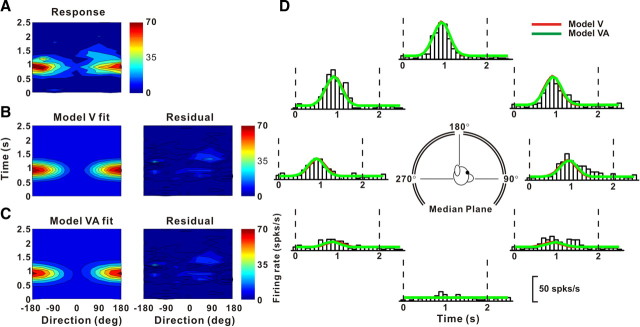
Figure 6.
Example fits of the velocity (model V) and velocity + acceleration (model VA) models to the spatiotemporal response profile of a neuron dominated by stimulus velocity. A, Direction–time plot showing how direction tuning evolves over the time course of the response (resolution: 45° and 100 ms). B, C, Model fits (left) and response residuals (right). For model V (B): t0 = 0.80 s, θ0 = 181°, r2 = 0.85. For model VA (C): t0 = 0.90 s, θ0 = 181°, wv = 0.78, r2 = 0.86. D, Response PSTHs (open bars) for the eight directions in the median plane (see inset), along with superimposed fits of model V (red) and model VA (green). Vertical dashed lines mark the 2 s duration of the stimulus.

