Figure 9.
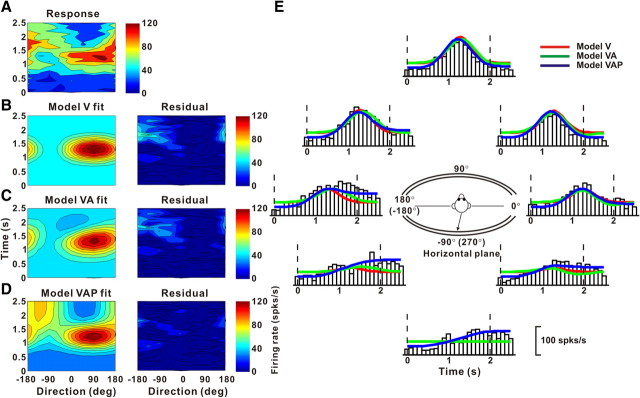
Example fits of models V, VA, and VAP to responses of a neuron showing a position component. A, Direction–time plot. B–D, Model fits (left) and response residuals (right). For model V (B): t0 = 1.16 s, θ0 = 92°, r2 = 0.51. For model VA (C): t0 = 1.44 s, θ0 = 106°, Δθva = 141°, wv = 0.67, r2 = 0.54. For model VAP (D): t0 = 1.11 s, θ0 = 78°, wv = 0.95, Δθva = 169°, wp = 0.58, Δθvp = 155,° r2 = 0.82. E, Response PSTHs (open bars) for the horizontal plane (see inset), along with model fits. The format is as in Figure 6.

