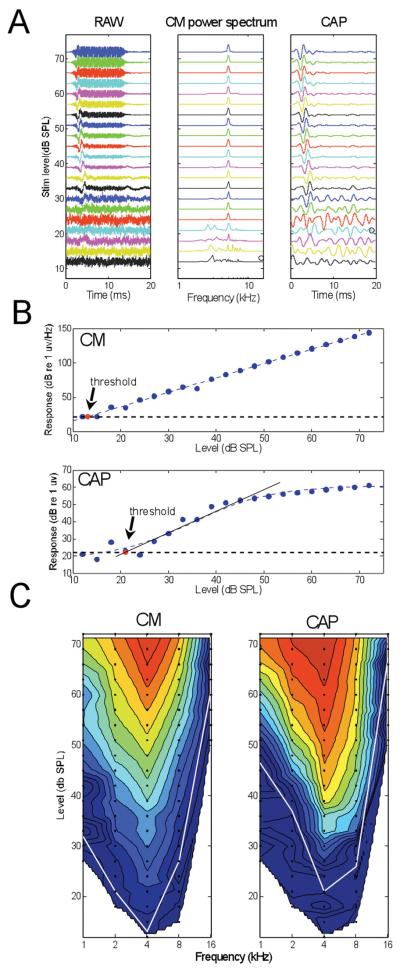
Figure 2.
Example CM and CAP recordings from just inside the round window. A: Level series at a single frequency (4 kHz). Left panel is the raw recording which contains the sinusoidal CM lasting for the duration of the stimulus and riding on the CAP which occurs near the beginning of the stimulus. Middle panel is the power spectrum of the CM, taken from an epoch (7-12 ms) uncontaminated by the CAP. Right panel is the raw recording filtered from 500-1.5 kHz to extract the CAP. Signals in each panel are normalized to the maximum amplitude for each stimulus level, such that the noise levels increase as the stimulus level is lowered. B: Thresholds for the CM and CAP were estimated as the stimulus level at which the response reached the noise floor. For the CM, the linear response was fit with a straight line. For the CAP, the saturating response was fit with a logistic function, and a line fit to slope at the 50% response magnitude. C: Contour plots of CM and CAP magnitude as a function of frequency and level. The color scale for the contour plot of the CM is from 25 (dark blue) to 160 dB (red, re 1 μV/Hz) and for the CM is from 25 to 60 dB (re 1 μV). The same color scales were used for all contour plots herein. Data points taken are shown as filled circles. The white lines are thresholds at each frequency.

