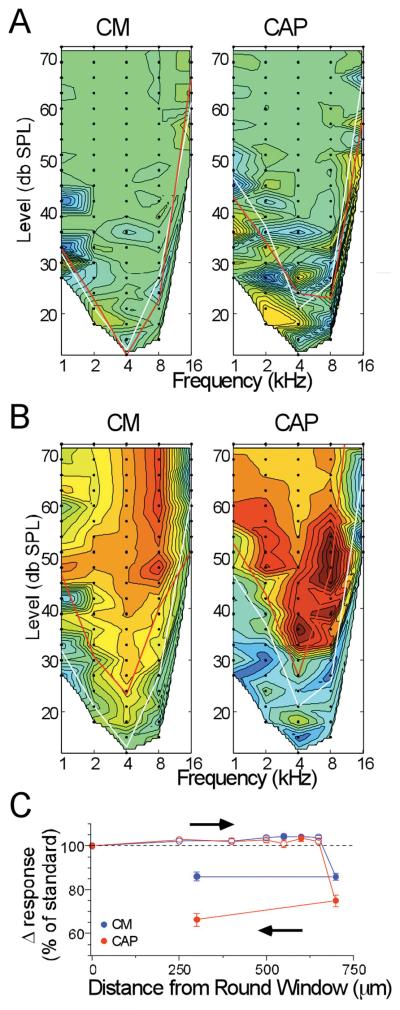
Figure 3.
Results of CM and CAP recordings at different depths of insertion. A: Depth = 250 mm. B: Depth=700 mm. These figures are contour plots of the difference between the standard response at the round window and the test response at the depth of insertion. Green is no difference, blue is an increased response and red is a decreased response compared to the standard (color scale of the CM is from 25, dark blue, to 160 dB, red, re 1 μV/Hz, and for the CM is from 25 to 60 dB, re 1 μV). White lines are the thresholds of the standard and red lines are the thresholds at the test depth. C: Results of the complete track in this case. Each point is the average response of all data points that were above threshold in either the test or standard, expressed as a percent of the average response level at the round window (responses measured in dB, as in Figure 2B).

