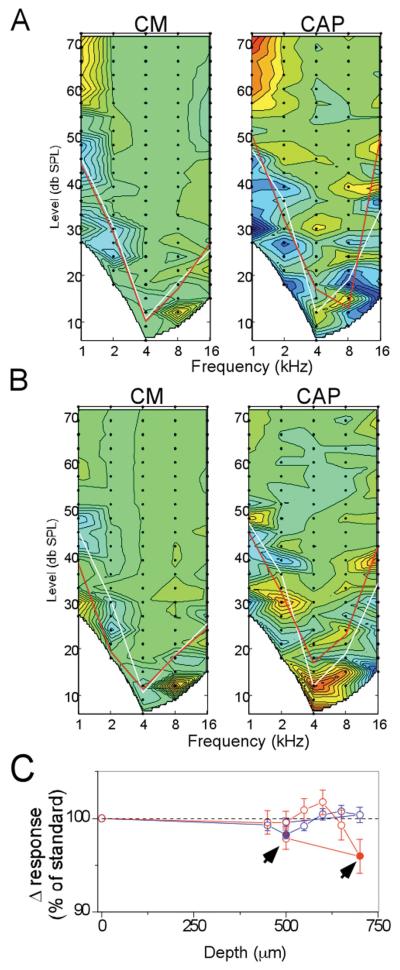
Figure 5.
Example of a case where the physiological changes were reversible when the electrode was withdrawn. A: An initial significant decrease in the CAP magnitude occurred at low frequencies and high intensities, with a smaller and not significant change in the CM. B: After the electrode was withdrawn, the response changes disappeared (color scale of the CM is from 25, dark blue, to 160 dB, red, re 1 μV/Hz, and for the CM is from 25 to 60 dB, re 1 μV). C: The complete track for this case, with the sites shown in A and B indicated by arrowheads (right arrowhead is shown in A, and left arrowhead is shown in B).

