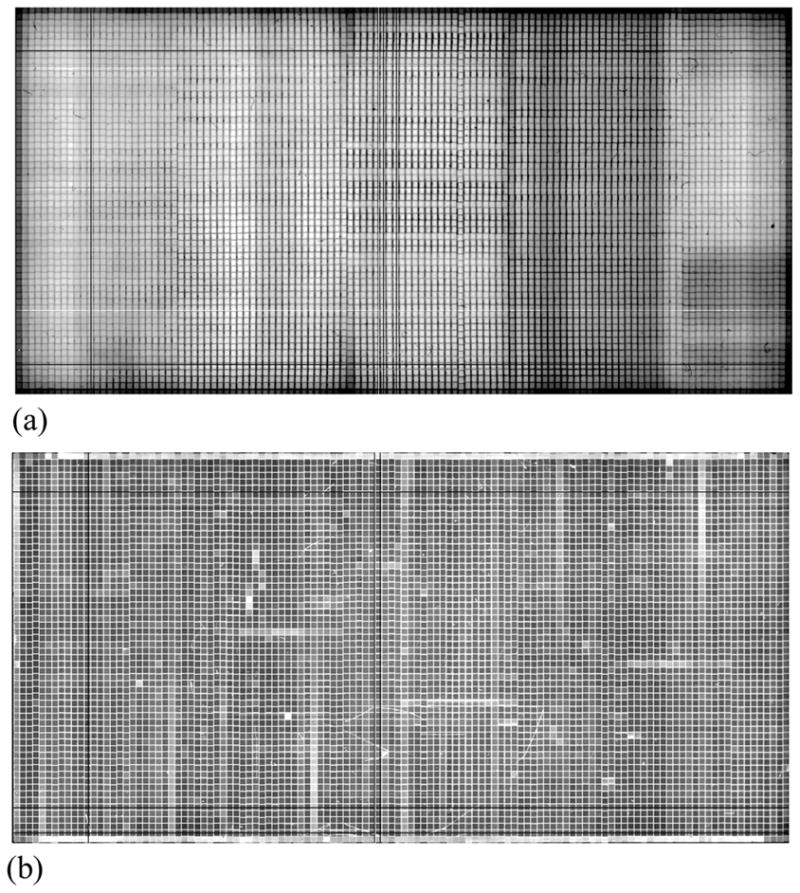
Figure 2.

Flood images acquired at 6 MV at a dose of ~0.133 cGy using (a) CsI-1 and (b) BGO-1. Note that the observed grid of lines with lower signal (darker) for CsI-1 and higher signal (whiter) for BGO-1 correspond to the septal walls. See text for further details.
