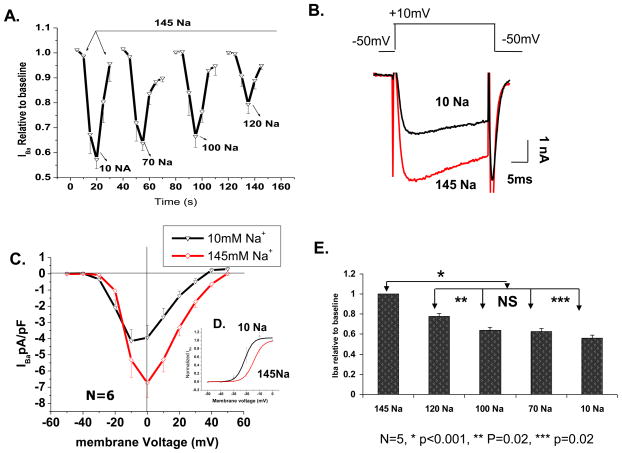
Figure 7. Reducing extracellular Na+ leads to L-type IBa suppression in a similar fashion as ICa.
A) Cumulative time course of suppression in four external NaCl concentrations (mM) of 10 (a), 70 (b), 100 (c) and 120 (d) (N=5 at each concentration). The duration of each response is depicted on the time-axis. The arrow points to control and washout and the valleys represent peak amplitude suppression at the given Na+ concentration. B) representative Ba2+ current trace from a single myocyte exposed to 145 and 10 mM NaCl. C) I-V relation of IBa in 145mM (◇) and 10 mM (▽) NaCl extracellular solutions (N=6). D) Activation curve of IBa in high (◇) and low (△) extracellular Na+. E) Quantitative representation of (A).

