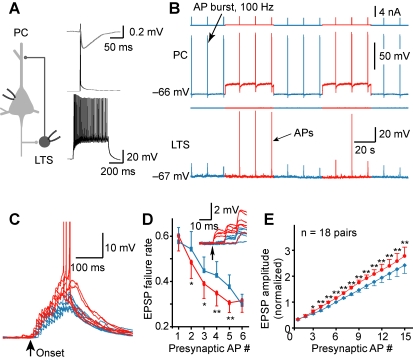
Figure 4. V m-dependent modulation of the slow recurrent inhibition is mediated by LTS interneurons.
(A) Left, schematic diagram of the PC-LTS paired recording. Right, the characteristic firing pattern of the LTS was shown at the bottom (in response to a square pulse of 0.2 nA); single AP (middle) in the LTS could evoke an IPSP (top) in the PC. (B) Example recording from the PC-LTS pair shown in (A). Presynaptic depolarization (∼20 mV) increased the peak amplitude of the summated EPSPs (evoked by a burst of 15 APs at 100 Hz in the PC) and occasionally caused AP firing in the LTS. (C) Overlay of the summated EPSPs recorded at the LTS. Note the facilitated EPSPs. (D) The failure rate of the 2nd to 5th EPSPs decreased after presynaptic depolarization. Inset, example traces showing EPSP failures occurred at resting (blue) and depolarized V m (red); arrow indicates the onset of the presynaptic AP train. (E) Group data (mean ± s.e.m., including EPSP failures) indicating the facilitation of individual EPSPs after presynaptic depolarization. Peak amplitudes of individual EPSPs were normalized to the 6th EPSP at resting presynaptic V m. See also Figure S3.

