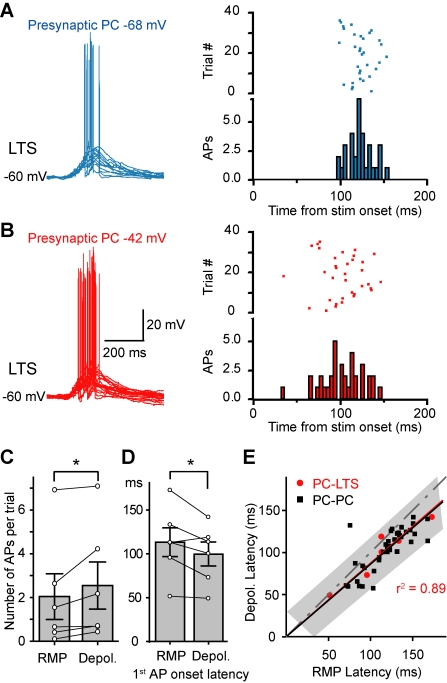
Figure 5. PC depolarization increases the number and reduces the onset latency of LTS APs.
(A) Left, overlay of example postsynaptic responses of LTS to a train of presynaptic APs at resting presynaptic V m. Right, rasters and peristimulus histogram showing the number and timing of APs in LTS across trials. (B) Same cell as in (A). Presynaptic V m was depolarized to −42 mV. Notice the increase in number of APs and the decrease in AP onset latency. (C) Presynaptic depolarization significantly increased the number of APs per trial in LTS cells. (D) Comparison of the 1st AP onset latency at resting versus depolarizing V m. mean ± s.e.m. * p<0.05. See also Figure S4. (E) Plot of the onset latency of disynaptic IPSPs in PC-PC pairs (black symbols; data from Figure 1) and LTS spiking in PC-LTS pairs (red symbols; data from panel D) at depolarized V m as a function of those at resting V m. Note that the majority of the points lie below the dotted line (slope = 1), indicating the latencies at depolarized V m were shorter than those at resting V m. Gray area indicates the 95% prediction bounds for IPSP latencies. Note that the points for LTS spiking latencies fall in this prediction bounds. The black and red lines are the linear regression fits for the IPSP and LTS spiking latencies, respectively.

