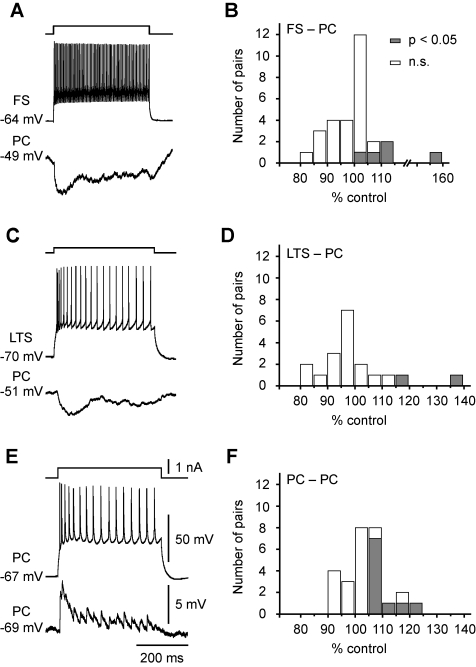
Figure 7. V m-dependent modulation of monosynaptic IPSPs and PC-PC EPSPs.
(A) Example recording showing inhibitory connection in a FS-PC pair. (B) Group data from FS-PC pairs. Filled boxes, pairs that showed significant increase in the average peak amplitude of IPSPs evoked by single APs (1 Hz, similar protocol as in Figure 6A) after presynaptic depolarization (∼20 mV). Open boxes, pairs without significant facilitation. (C) Example recording showing inhibitory connection in a LTS-PC pair. (D) Group data for LTS-PC pairs. (E) Example recording showing excitatory connection in a PC-PC pair. (F) Group data for PC-PC pairs.

