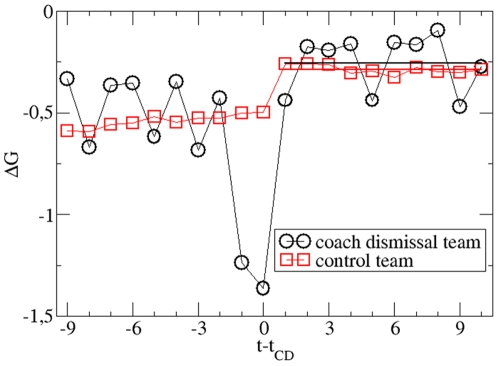
Figure 2. Comparison of the CD (coach dismissal) with the control teams based on the average goal difference.
The time axis is shifted with respect to the time of the CD (occurring directly after match day tCD) to enable comparison of different events. The average values for the prediction period are included as solid lines. No effect of the CD is present within statistical errors.

