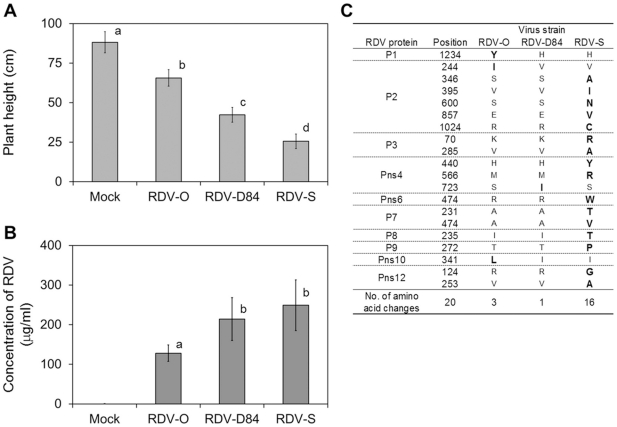
Figure 1. Characterization of three RDV strains.
A): Heights of plants infected with three RDV strains at 40 dpi. Common letters are not signficantly different at the 1% level by least significant difference test. Vertical lines indicate standard deviation. B): Concentrations of RDV strains at 30 dpi estimated by enzyme-linked immunosorbent assay. Vertical lines indicate standard deviation. Common letters are not significantly different at the 5% level by least significant difference test. Vertical lines indicate standard deviation. C): Amino acid substitutions of three RDV strains.

