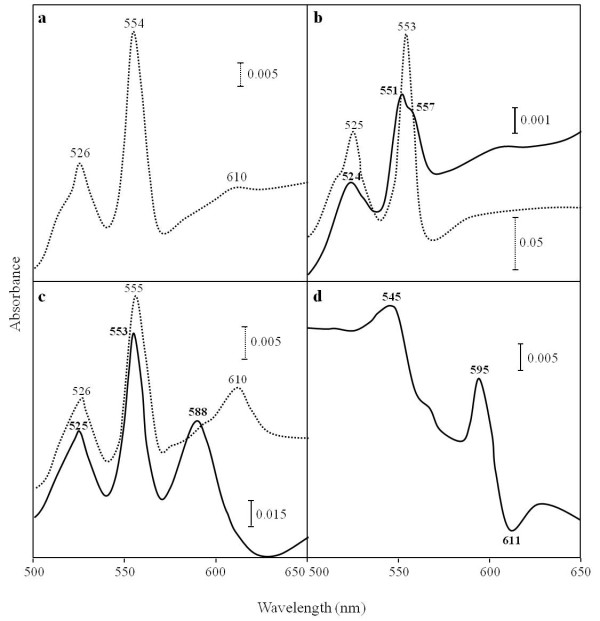
Figure 2.
Spectra of cytochromes in A. pernix. Difference spectrum in the sodium dithionite-reduced form minus the air-oxidized form (dotted line) and pyridine ferro-hemochromes (solid line) of membranes (a), cytochrome c553 (b), and cytochrome oa3 oxidase (c). To measure a spectrum of membranes, they were solubilized with 5% (w/v) Triton X-100, as described in Materials and Methods. Difference spectrum of the CO-reduced minus the reduced forms of cytochrome oa3 oxidase (d). The partially purified oxidase was reduced with sodium dithionite (baseline) and then bubbled with CO gas for 1 min.

