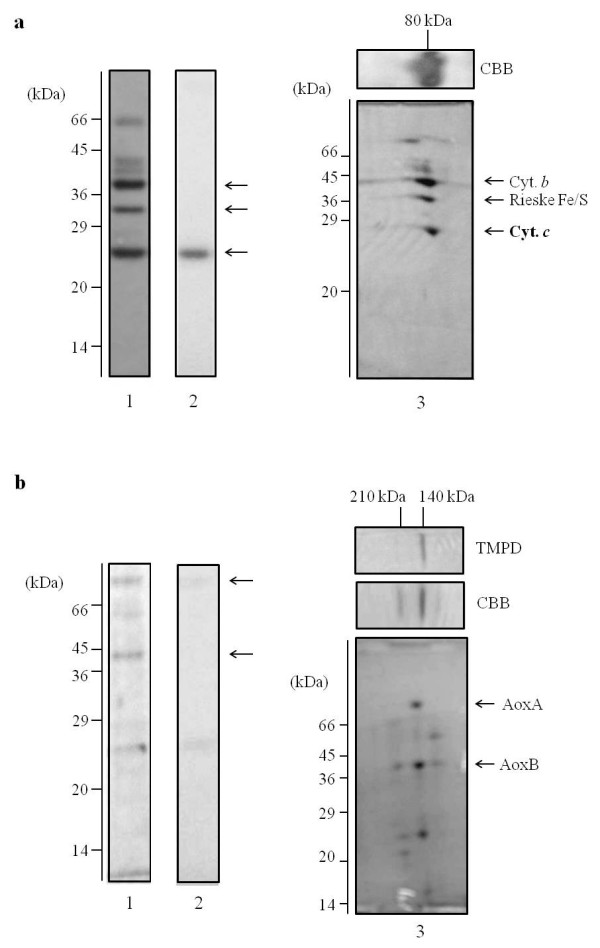
Figure 4.

SDS-PAGE (panel 1 and 2) and Two-dimensional electrophoresis analysis (panel 3) of the cytochrome c553 (a) and cyothcrome oa3 oxidase (b) from A. pernix. The acrylamide concentration of the SDS-PAGE gel was 13.5%. The gel was stained for protein with CBB (panel 1) and for heme with o-toluidine in the presence of H2O2 (panel 2). The samples were analyzed by BN-PAGE (horizontal) and then SDS-PAGE (vertical, panel 3). A 5-18% acrylamide gradient gel was used for native PAGE, and the gels were stained with CBB. The cytochrome oa3 oxidase was revealed by its TMPD oxidation activity (b panel 3). The acrylamide concentration of the second dimension SDS-PAGE gel was 15%, and the gels were stained with CBB. Side bars indicate the molecular mass standards. The arrows indicate the corresponding subunits of the cytochrome c553 and cytochrome oa3 oxidase.
