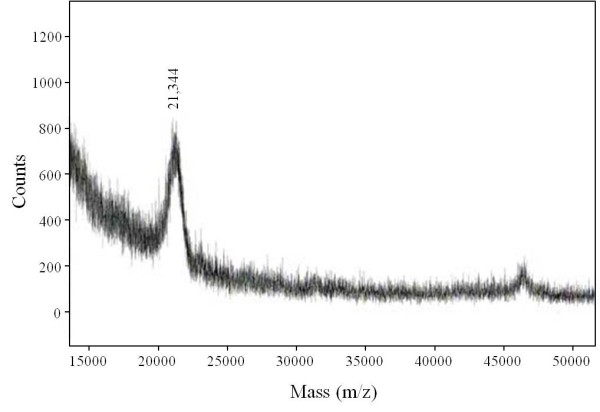
Figure 5.

MALDI-TOF mass spectrum of cytochrome c553 from A. pernix. Partially purified cytochrome c553 was separated by SDS-PAGE (Figure 4a, panel 1), and the 25-kDa band was extracted from the acrylamide gel. Mass spectrum analysis was performed as detailed in the Materials and Methods.
