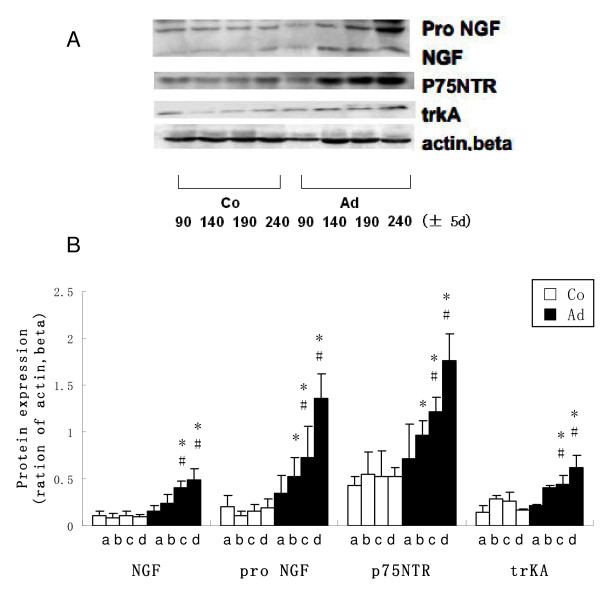
Figure 3.
Western-blot analysis of NGF-β, pro NGF, p75NTR and trkA in adenomyosis (Ad) and control (Co) ICR mice uteri. A: Representative Western-blot analysis of NGF-β, pro NGF, p75NTR and trkA in adenmoysis and control mice in different age groups. B: Densitometirc analysis of NGF-β, pro NGF, p75NTR and trkA in adenomyosis and control mice in different age groups expressed as a percentage after actin, beta normalization (n = 5; a = 90 ± 5 d, b = 150 ± 5 d, c = 190 ± 5 d, d = 240 ± 5d; *P < 0.05, compared with the control mice with the same ages; #P < 0.05, compared with the 90 ± 5 d mice with the same treatment).

