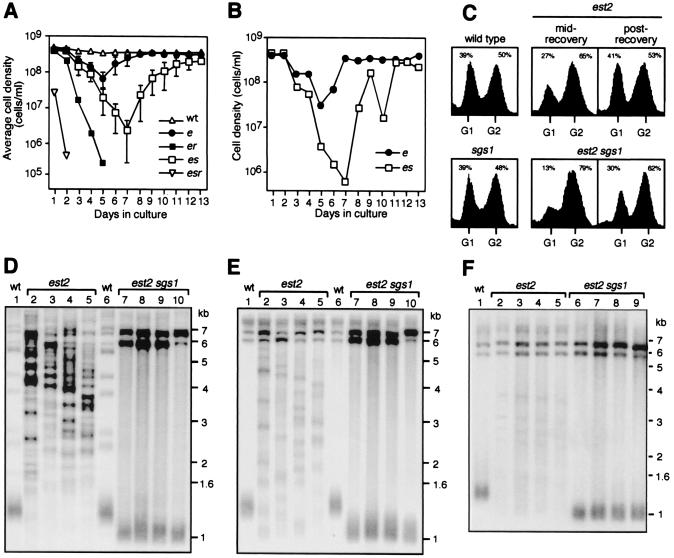
Figure 3.
Analysis of SGS1 function during senescence and recovery. Seventeen spore colonies of est2 (●), est2 sgs1 (□), est2 rad52 (■), and est2 sgs1 rad52 (▿) strains and two cultures of wild type (▵) were subcultured for 13 days. Each culture was inoculated to 1 × 10⁵ cells/ml and grown until the wild-type culture reached a cell density of 4 × 10⁸/ml. Each passage represented 11 generations of the wild-type strain. We estimated that strains had undergone ≈40 generations before day 1. (A) Average daily cell densities for each genotype. Error bars represent standard deviations. (B) Typical time course for individual cultures showing the typical loss of viability of est2 sgs1 survivors. (C) Representative flow cytometric analyses of wild-type, sgs1, est2, and est2 sgs1 cultures, 1 and 11 days after survivors were generated (mid- and post-recovery, respectively). Percentage of cells with a G1 or G2 DNA content are shown. (D) Poly[AC/TG]-probed Southern blot XhoI-digested genomic DNA from est2 (lanes 2–5), est2 sgs1 survivors (lanes 7–10), and wild-type (lanes 1 and 6) cultures on day 13. (E) Equivalent blot as for D but probed for Y′ sequences. (F) Y′-probed Southern blot of XhoI-digested genomic DNA from est2 and est2 sgs1 survivors 1, 2, 3, and 4 days after survivors were first generated. Lane 1, wild type; lanes 2–5, est2; and lanes 6–9, est2 sgs1.

