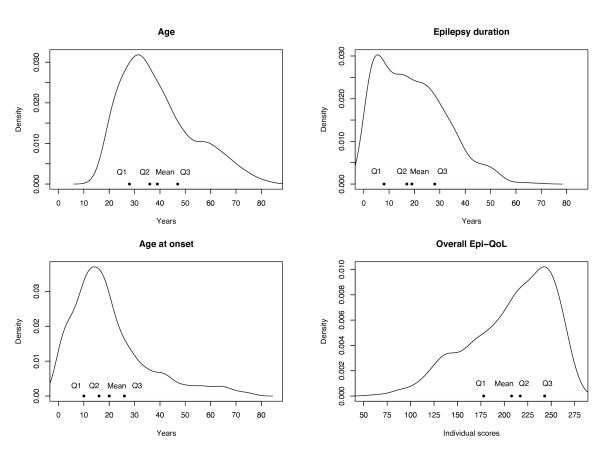
Figure 1.
Kernel density estimation plot of the univariate distributions of the age-related factors and overall Epi-QoL score. Density estimates were plotted along with quartiles and means of each variable. In each plot, Q1, Q2 and Q3 indicated the first, second (median), and third quartile, respectively. The bandwidths were about 3.34, 3.11, 2.81, 10.28 for age, duration, age at onset, and overall Epi-QoL score, respectively.

