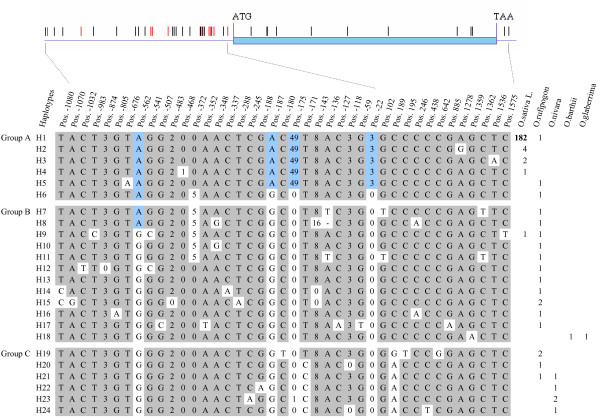
Figure 1.
Schematic position of nucleotide polymorphisms at OsAMT1;1 and haplotypes across the gene. The short red and black lines above the model of the gene represent Indels and SNPs respectively, and the numbers below the model indicate their positions relative to the first base of the start codon (ATG) of OsAMT1;1. For example, pos. 874 means the distance between that SNP and the ATG of OsAMT1;1 is 874 bp in 'Nipponbare'. In each haplotype, letters indicate alternative nucleotides at a given position, numbers represent the size (bp) of a deletion (0 = no deletion), and the line of short dash in haplotype H8 represents a 1 bp deletion. Numbers to the right are those of the accessions contained in each haplotype.

