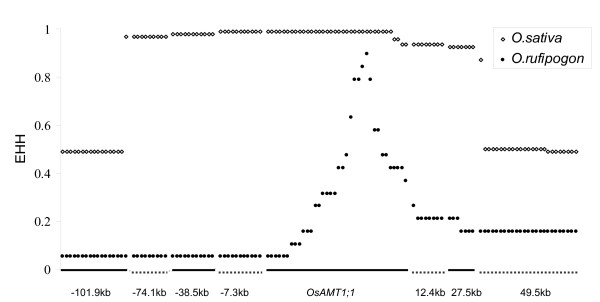
Figure 4.
Extended haplotype homozygosity (EHH) analysis across the OsAMT1;1 genomic region. White diamonds and black dots indicate EHH values for O. sativa and O. rufipogon respectively. Broken horizontal lines along the X-axis indicate the polymorphisms corresponding to specific sites relative to OsATM1;1.

