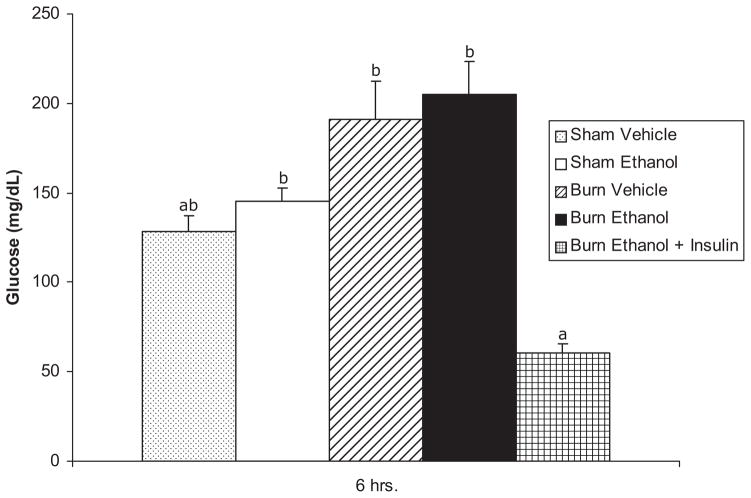
Figure 2.
Blood glucose levels. Glucose levels of ethanol treated and/or burn-injured ± insulin-treated mice at 6 hours postinjury. Data are expressed as mean ± SEM. n = 10–20 per group. Data are analyzed by one-way analysis of variance and Tukey-Kramer post-hoc testing for statistical significance. P < .05 for groups not sharing a letter.

