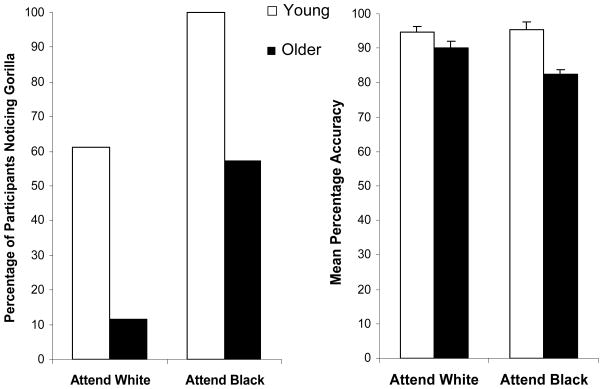
Figure 1.
Percentage of total participants who noticed the unexpected stimulus (left panel) and mean percentage accuracy on counting task by condition and age group (right panel).
Note. There are no error bars on the left panel, as this represents the percentage of total participants noticing the unexpected stimulus on a single trial. Error bars (right panel) represent one standard error.

