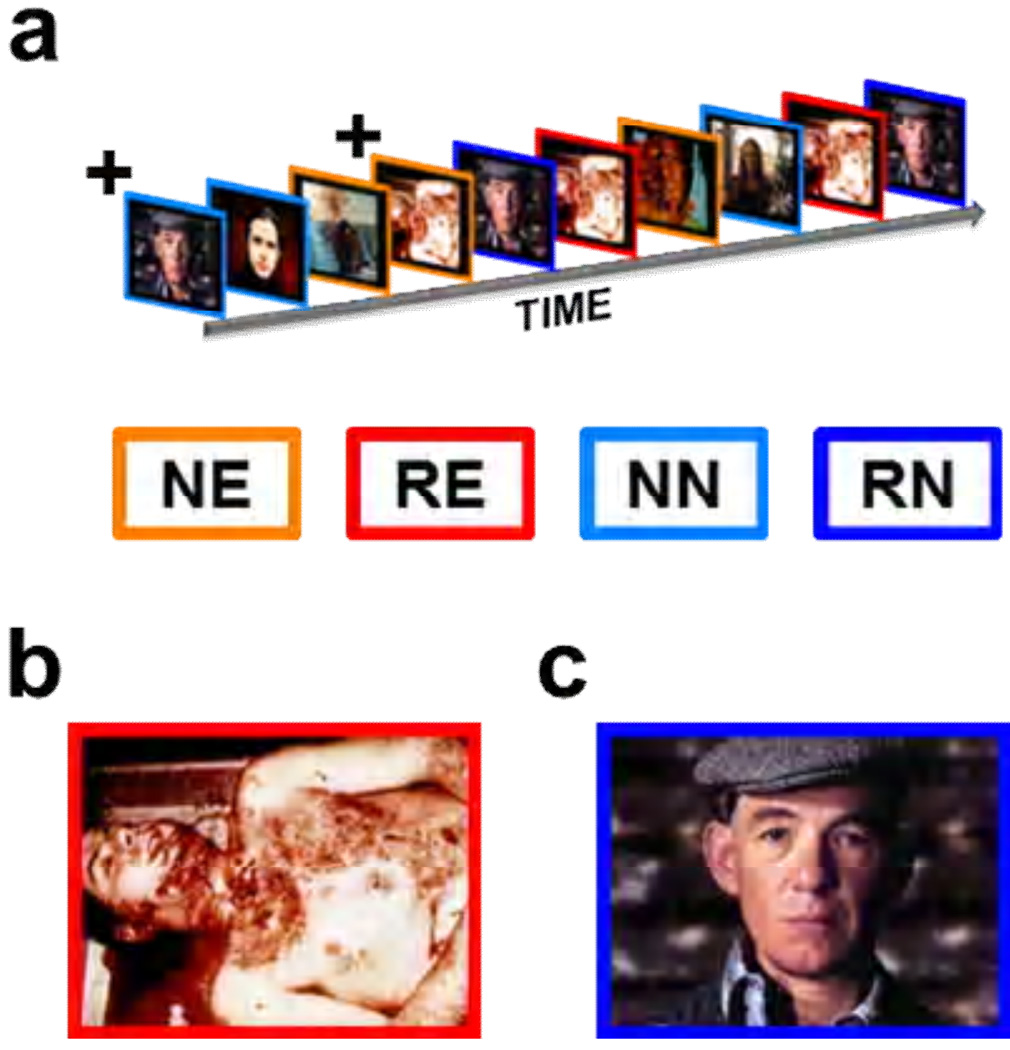
Figure 1. In Experiment 1 we presented emotional and neutral images while measuring BOLD activity.
(a) Images were presented sequentially in an event related design. (b,c)The images are representative of the emotional (b) and neutral (c) images shown to participants. All participants saw 5 presentations of novel emotional (NE) and 5 presentations of novel neutral (NN) images indicated by the orange and light blue outlines, respectively. In addition all saw 5 repetitions of one emotional (RE) and one neutral (RN) image, shown in red and blue respectively.
+The initial presentation of the repeated stimuli was counted as novel.

