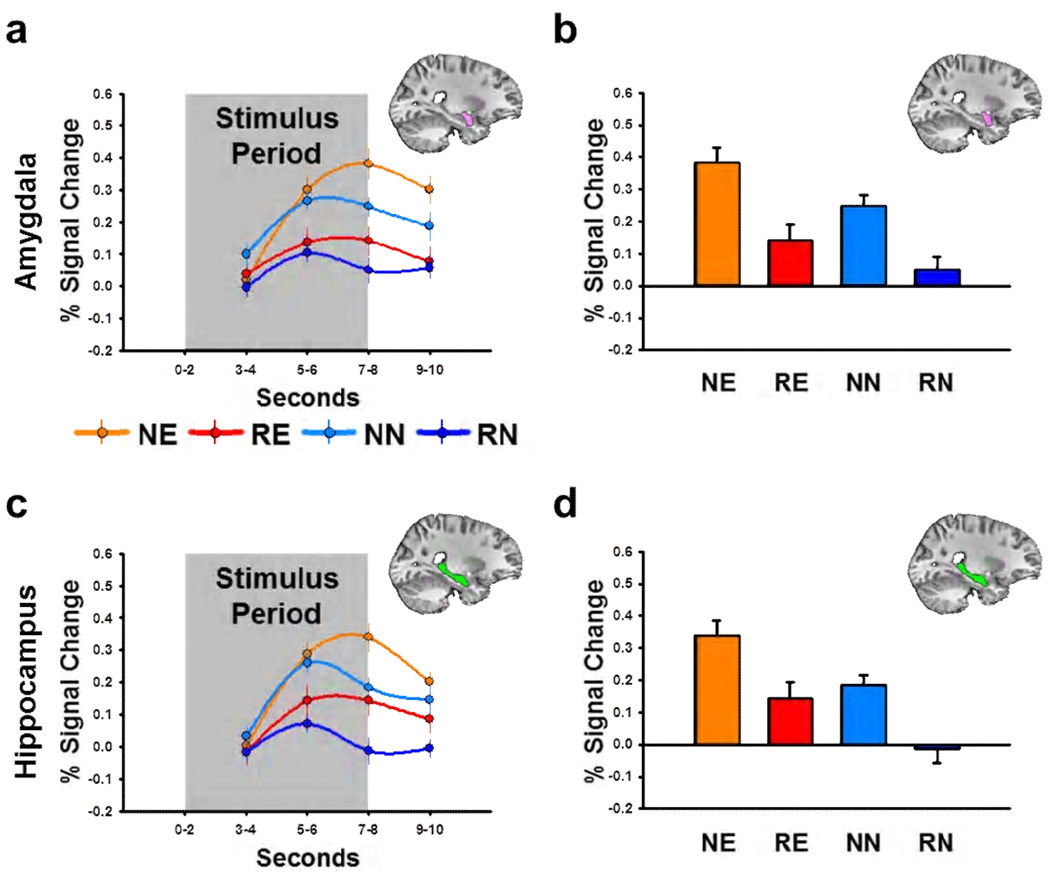
Figure 4. Novel emotional and novel neutral stimuli drive BOLD activity in the amygdala and hippocampus.
(a,c) Line graphs represent BOLD timecourse in the amygdala (a) and hippocampus (c) during Experiment 1. (b,d) Bar graphs represent the percent signal change in the amygdala (b) and hippocampus (d) during the last two seconds of the stimulus period. All data points represent mean±SEM. (NE = novel emotional, RE = repeated emotional, NN = novel neutral, RN = repeated neutral)

