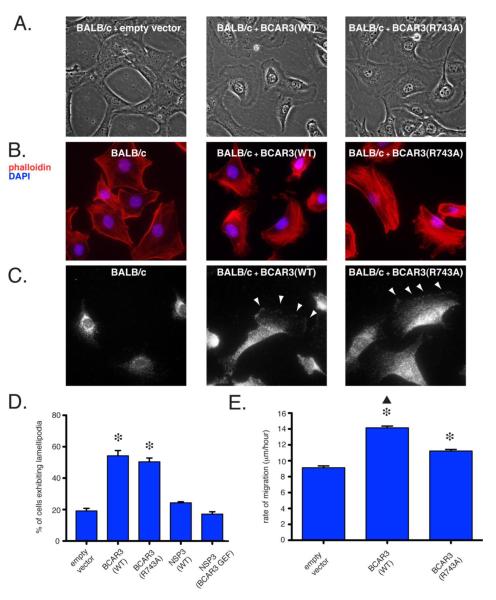
Figure 4. BCAR3-induced membrane lamellipodia formation is independent of association with p130Cas in BALB/c-3T3 cells, while BCAR3-induced motility is not.
(A) Phase contrast images of polyclonal populations of BALB/c-3T3 cells stably transduced with either an empty lentiviral vector, wildtype BCAR3 or R743A BCAR3 at 40X magnification. (B) BALB/c-3T3 cells and polyclonal populations of BALB/c-3T3 cells stably transduced with wildtype BCAR3 or R743A BCAR3 were stained with phalloidin (red) and DAPI (blue) to visualize actin stress fibers and nuclei, respectively (40x magnification). (C) BALB/c-3T3 cells and BALB/c-3T3 cells stably transduced with either wildtype or R743A BCAR3 were probed with anti-HA primary and Alexa Fluor 647 secondary antibodies to determine BCAR3 localization at 60X magnification. (D) Quantification of BCAR3-induced lamellipodia formation in BALB/c-3T3 and stably transduced populations of BALB/c-3T3 cells. Error bars depict the propagated error of the mean and significance was determined by one-way ANOVA (asterisk, p < 0.05 relative to BALB/c-3T3). (E) Mean rates of migration of BALB/c-3T3 cells were determined by measuring the distance traveled by cells over a 16 hour period following the scratching of a confluent cell monolayer. Significance was determined by one-way ANOVA (p < 0.05).

