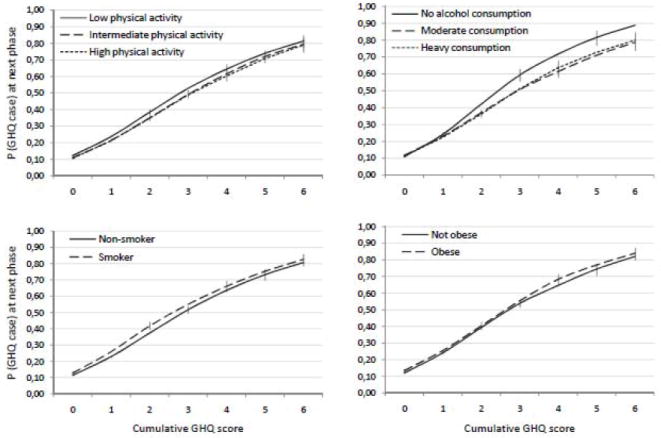
Figure 3.

Model-predicted probability (P) of GHQ caseness at phase PT+1 as a function of health-related risk markers and cumulative GHQ score at phase PT. The error bars are 95% confidence intervals. See the interaction effects of table 3 for statistical details. N=7934 participants, 35282 person-observations.
