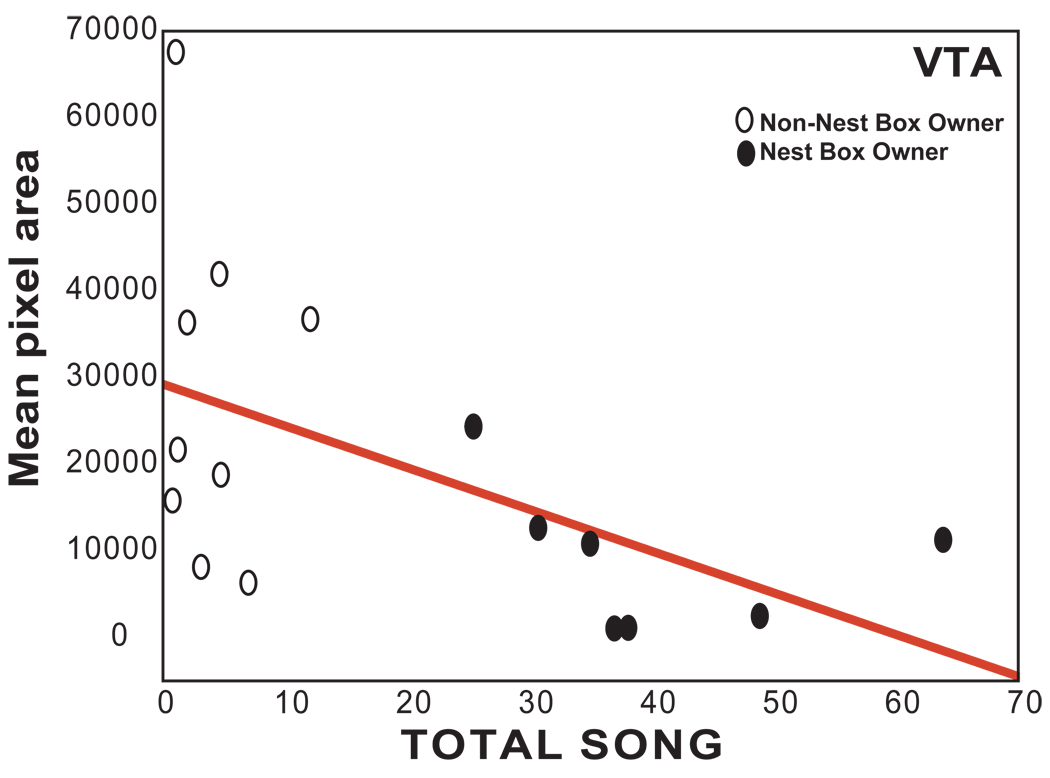
Figure 5.
Scatterplot showing the relationship between pixel area measurements in VTA and song. Each point represents one individual, darkened circles represent males with nest boxes, open circles represent males without nest boxes. Presence of the regression line indicates a significant relationship (p<0.05).

