
Figure 2.
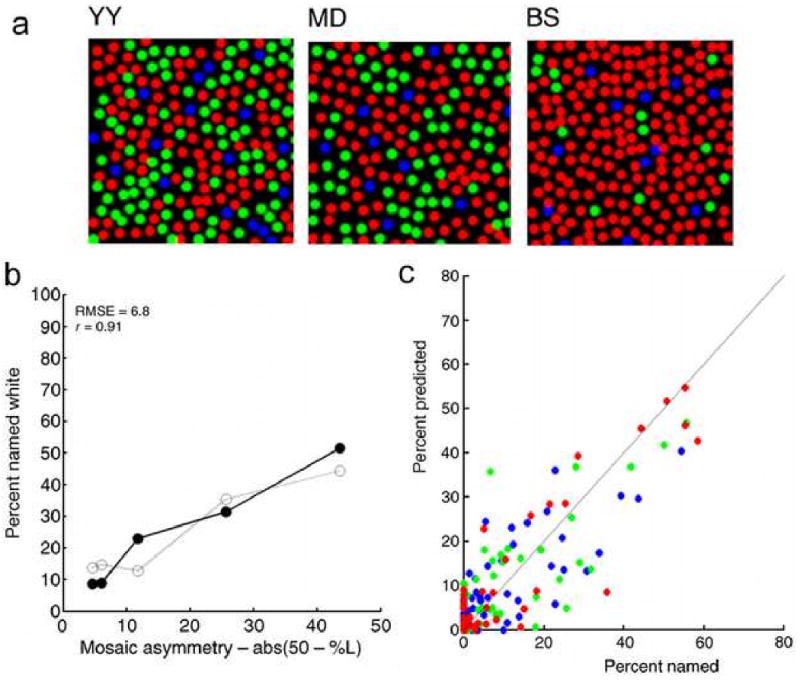
Optimal chromatic decoding given the human cone mosaic. (Adapted from Brainard, Williams & Hofer 2008). a. Cone mosaics of three (out of five) human observers measured with adaptive optics. b. Solid symbols show the percentage of trials where the subject reported seeing “white” when a small (receptor size) spot was flashed at a random location in the receptor lattice; open symbols show parameter free ideal-observer predictions. c. Observed vs. predicted color names for three different spot wavelengths (r = 0.83).