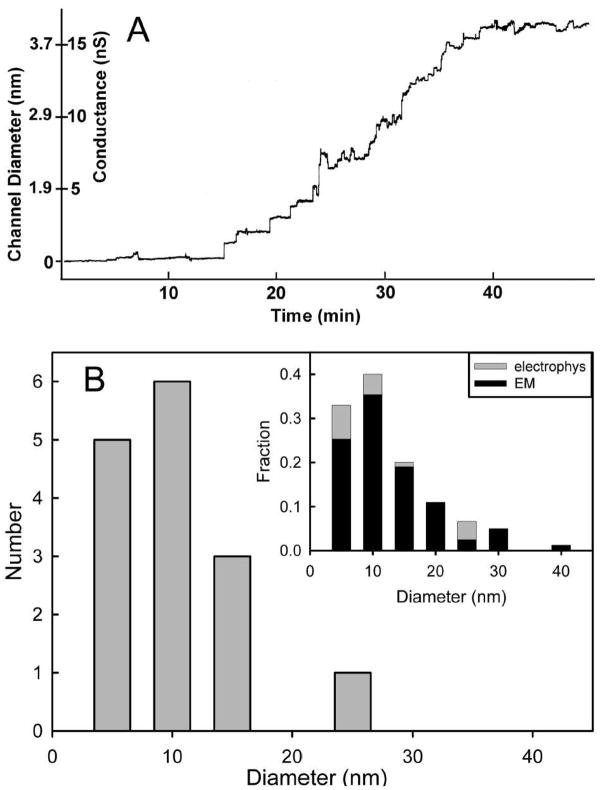
Fig. 7.
Sizes of ceramide channels measured from electrophysiological experiments. (A) A typical trace of conductance increments in a planar phospholipid bilayer following the addition of C16-ceramide to the aqueous compartment. This is the growth of a single ceramide channel [15]. The calculated channel diameter is also indicated on the y-axis. (B) Histogram of the calculated size of ceramide channels from many experiments such as the one illustrated in (A). In the inset, the number of events is expressed as a fraction of the total number of events and the results from electron microscopy (EM) and electrophysiological recordings (electrophys) are plotted together for comparison.

