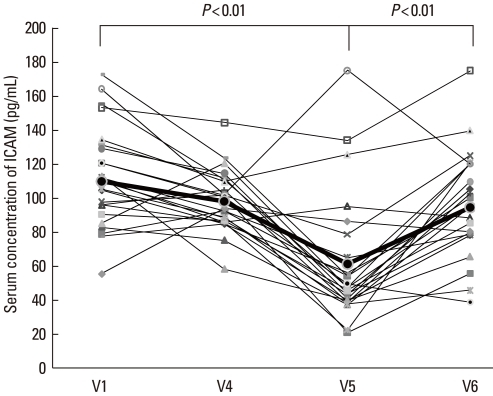
Fig. 8.
Intracellular cell adhesion molecule (ICAM)-1 concentration before (V1) and during therapy (V4), and at 3 (V5) and 6 months (V6) after the last IVIg injection. The ICAM-1 concentration was significantly lower at the 3-month follow-up visit (V5) compared with the concentration at V1, but it had increased by the 6-month follow-up visit (V6).

