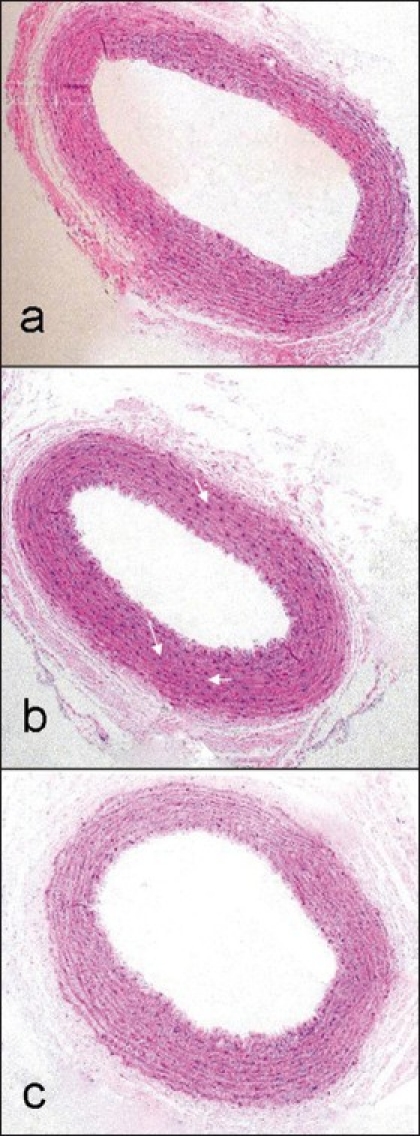
Figure 2.

Histological analyses of basilar artery, (a) control group, (b) cholesterol group, (c) cholesterol + Vitamin E (100× magnifications). In the cholesterol group (b), there were disturbances in the subendothelial with neutrophil infiltration (white arrows)
