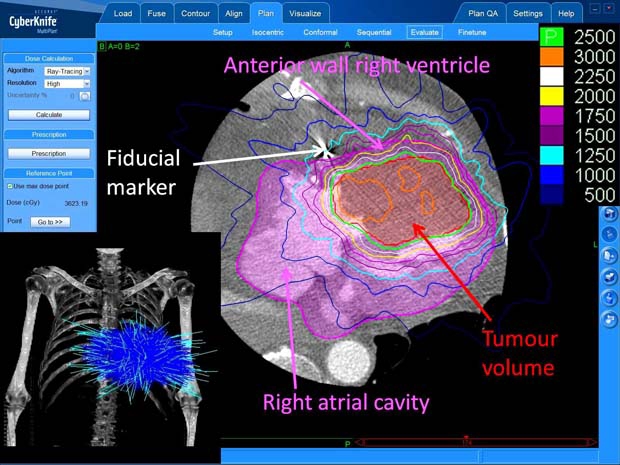
Figure 2.

Axial slice from cardiac-gated CT scan used to assist treatment planning. The tumour volume is shown in red overlay, and whole heart volume in pink overlay. The radiation isodose arrangement is superimposed, with the isodose key shown top right (doses are in centigray, where 100 centigray=1 gray (Gy)). The radiotherapy beam arrangement is shown on the skeleton view (bottom left). One hundred and ninety eight individual beams of radiation (light blue) converge on the target to give the optimum dose distribution.
