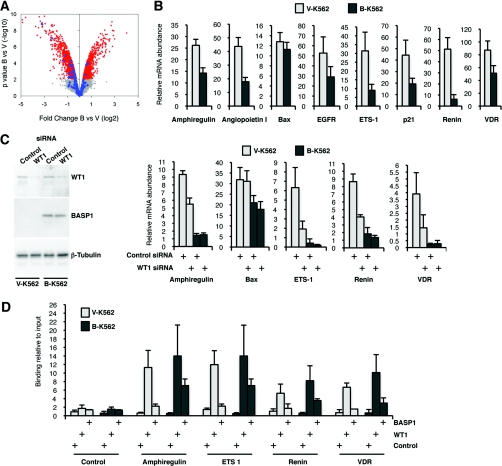
Figure 2. Expression of BASP1 in K562 cells leads to the general down-regulation of WT1 target genes.
(A) Microarray analysis was performed with B-K562 cells and V-K562 cells and the data were analysed as described in the text. A volcano plot shows that, even though B-K562 cells show an equivalent number of repressed and activated genes, the vast majority of altered WT1 target genes are repressed. Signal within the grey area indicates small changes below the level of significance, whereas the red area shows significant changes. The known WT1 target changes are indicated in blue. Full details of the expression changes observed in V-K562 and B-K562 cells are shown in Supplementary Table S1 (at http://www.BiochemJ.org/bj/435/bj4350113add.htm). The probesets representing the WT1 target genes are shown in Supplementary Table S2 at http://www.BiochemJ.org/bj/435/bj4350113add.htm. Sources of the WT1 target genes are cited throughout the text and also include genomic analysis and reviews [2,25,42,43]. (B) qPCR was performed to quantify the expression of the genes indicated. Results are presented as the expression relative to GAPDH (glyceraldehyde-3-phosphate dehydrogenase) mRNA. Values are means±S.D. for three independent experiments. (C) V-K562 and B-K562 cells were transfected with control siRNA or WT1 siRNA and 48 h later whole-cell extracts or RNA were prepared. Samples were immunoblotted with anti-WT1, anti-BASP1 or anti-β-tubulin antibodies. The right-hand panels show the expression of the indicated genes as determined by qPCR. Values are means±S.D. for three independent experiments. (D) V-K562 and B-K562 cells were subject to ChIP analysis with either control, anti-WT1 or anti-BASP1 antibodies. qPCR was used to amplify the WT1-binding sites of the indicated genes or a control region. The results are expressed as the percentage of bound chromatin compared with input. Values are means±S.D. for three independent experiments.

