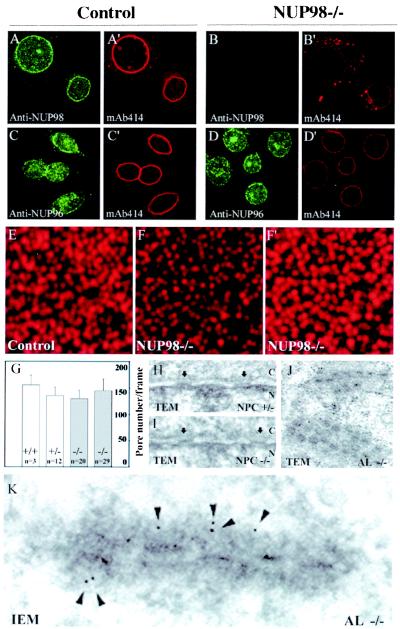
Figure 2.
NUP98 knockout cells have a normal NPC density but increased numbers of AL. (A–D) Representative confocal images of control (A and C) and knockout (B and D) cells double stained with NUP98(151–221) antibody (A and B) and monoclonal antibody mAb414 (A' and B') or with NUP96 antibody (C and D) and mAb414 (C' and D'). (E, F, and F') Representative high-resolution confocal images of mAb414-stained nuclear pores (focused on the top of the nucleus). (E) Control cell. (F) NUP98−/− cell. (F') Same image as shown in F except that the brightness of the image has been enhanced by computer processing. (G) Quantification of nuclear pore densities: bar diagrams showing the average nuclear pore densities of two independent NUP98−/− lines; an NUP98+/+ line (n = 3 cells) and an NUP98+/− line (n = 12 cells). Error bars represent standard deviations. (H and I) Analysis of NPC and NE integrity by TEM. Arrows mark nuclear pores; n, nuclear face; c, cytoplasmic face. (H) Nuclear pores in a control cell. (I) An NUP98−/− cell. (J) TEM micrograph showing AL of a knockout cell. (K) Immunogold electron micrograph with mAb414. Shown is an AL from an NUP98−/− cell decorated with 5-nm gold particles (arrowheads).

