
Fig. 3.
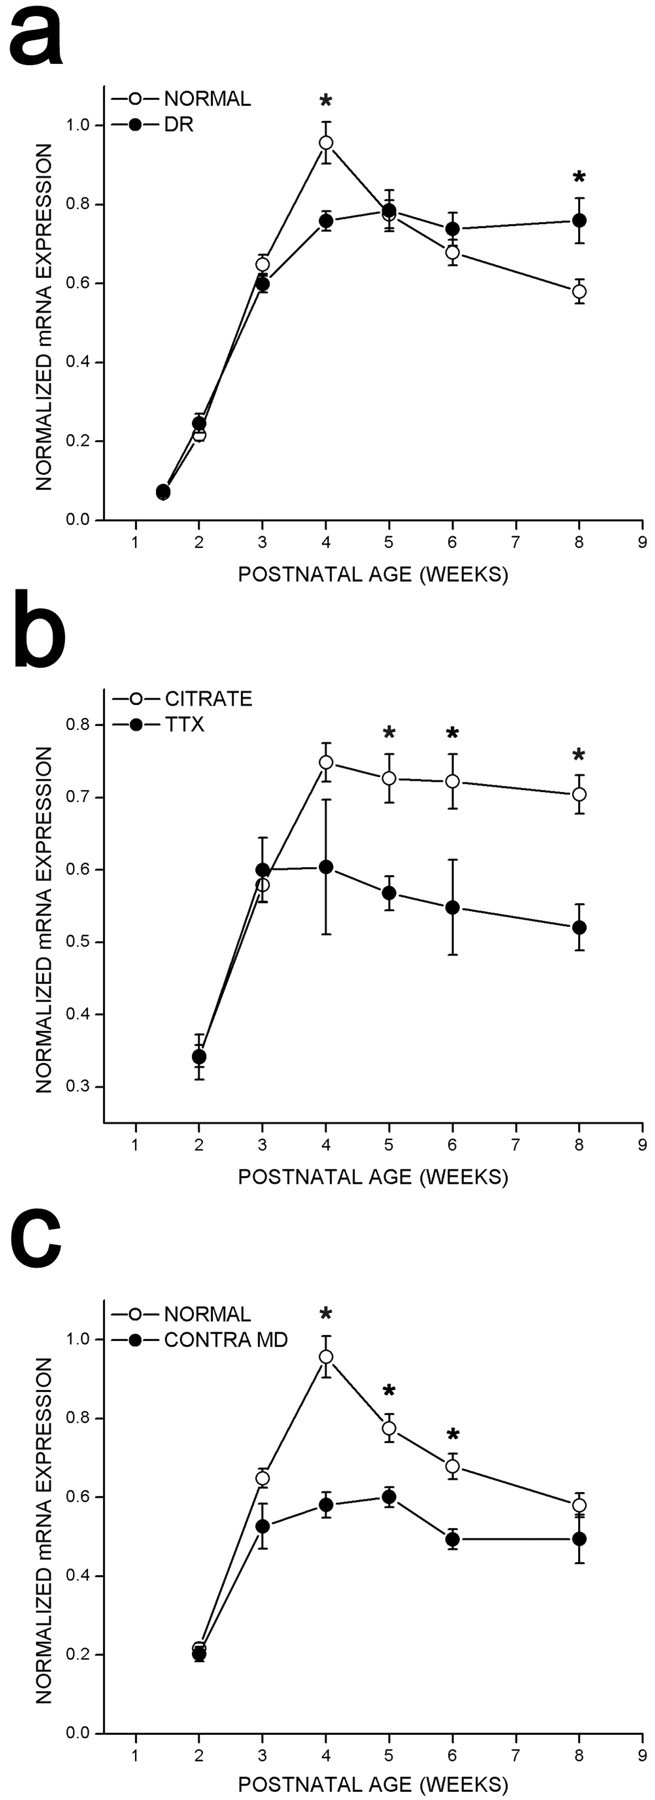
Quantification of cpg15 expression in the VC of control (normal) rats, DR rats, rats after blockade of retinal activity, or rats after MD. In all cases, after background subtraction, the net average pixel value in the VC was normalized by the net average pixel value of the MGB (see Materials and Methods for details). a, Effect of dark rearing oncpg15 expression in the VC. Data from four in situ experiments are shown, of which Figure 2 is representative.Solid circles, DR animals; open circles, untreated control animals. Error bars indicate the SEM. Points marked with asterisks are significantly different between normal and DR animals (at 4 weeks, p = 0.001; at 8 weeks, p = 0.016; unpaired Student'st test). b, Effect oncpg15 expression in the VC of monocular TTX blockade for 3 d initiated at different developmental times. Data from threein situ experiments are shown, of which Figure 5 is representative. Solid circles, VC contralateral to TTX blockade; open circles, VC of control animals implanted with a citrate control in the contralateral eye. Error bars indicate the SEM. Points marked with asterisks are significantly different between the VC of control and TTX-treated rats (at 5 weeks,p = 0.0012; at 6 weeks, p = 0.032; at 8 weeks, p = 0.0008; unpaired Student'st test). c, Effect oncpg15 expression in the VC of MD for 3 d by eyelid suture initiated at different developmental time points. Solid circles, VC contralateral to the sutured eye; open circles, VC of untreated control animals. Error bars indicate the SEM. Points marked with asterisks are significantly different between the VC of control and MD rats (at 4 weeks,p = 0.003; at 5 weeks, p = 0.006; at 6 weeks, p = 0.007; unpaired Student'st test).