
Figure 4.
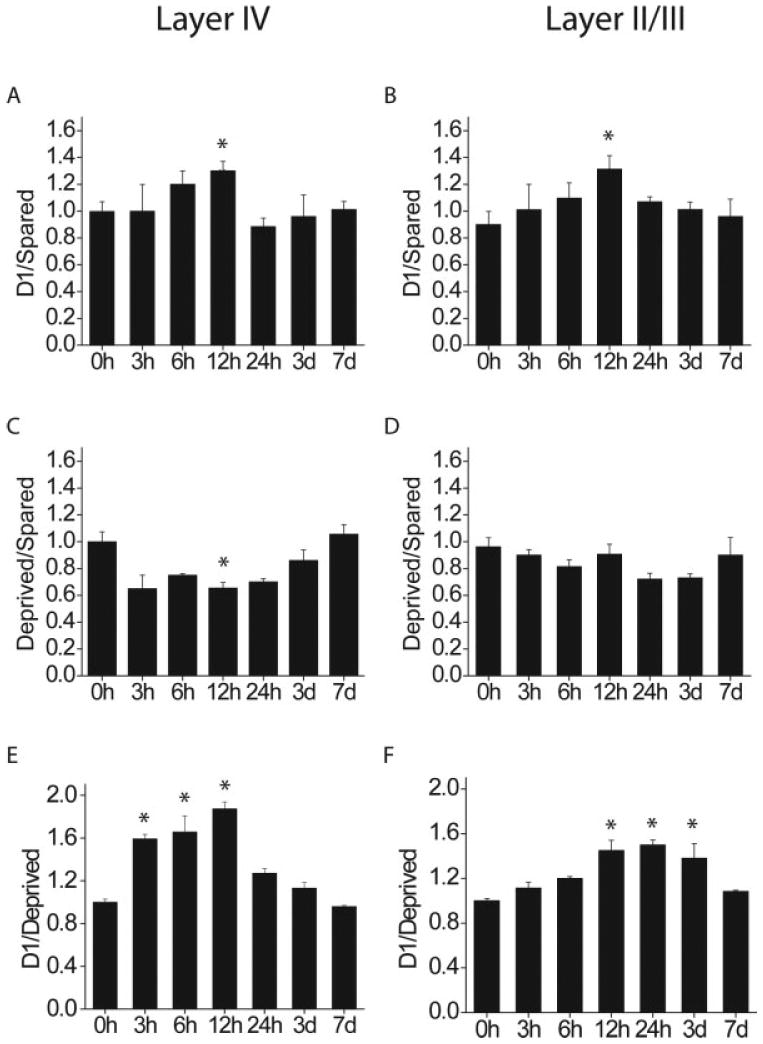
Quantification of the D1/Spared, Deprived/Spared, and D1/Deprived ratios in layers IV (A, C, E), and II/III (B, D, F) as a function of single whisker experience time (n = 2 per time point, 2–3 sections per brain). Compared to 0 h controls, *p < 0.0024 (5% significance level). Although cpg15 induction in D1 (A, B) and depression in the deprived barrels (C, D) are significant only at 12 h (likely due to the small sample size at other time points), the net change in cpg15 expression, combining induction in D1 and depression in the deprived neighboring barrel units (D1/Deprived) shows a significantly different time course in layers IV and II/III.